
It’s a typical summer day in 2029, and you step outside your Phoenix home to grab the mail. Within minutes, your body temperature starts climbing. Your heart races. You feel dizzy, nauseous. You stumble back inside, wondering if you’re getting sick.
You’re not sick. You’re experiencing what scientists now know will become the new reality for millions of Americans—living in places that are technically survivable, but no longer truly livable.
Here’s the shocking part: everything we thought we knew about human heat tolerance? We got it catastrophically wrong.
The 35°C lies that’s been putting millions at risk
🌡️ Human Heat Tolerance: The Deadly Miscalculation
Age-Based Heat Tolerance Thresholds
For decades, scientists have told us that humans can survive wet-bulb temperatures up to 35°C (95°F with 100% humidity). This number has shaped climate projections, emergency protocols, and migration planning worldwide.
But groundbreaking new research reveals a terrifying truth: the actual human survival limit is 0.9 to 13.1 degrees Celsius lower than we thought.
For young, healthy adults, the real survival threshold ranges from 25.8°C to 34.1°C wet-bulb—not 35°C. For older adults, it drops to a devastating 21.9°C to 33.7°C. In dry conditions, anyone over 65 cannot survive beyond 21.9°C wet-bulb.
That’s not a typo. We’ve been underestimating the danger by more than 13 degrees.
But here’s what makes this even more alarming: there’s a crucial difference between “survivability” (staying alive for 3-6 hours) and “liveability” (being able to function, work, or live normally). Many American regions are rapidly approaching the point where you might survive stepping outside, but you definitely can’t live there.
Your region’s countdown to uninhabitable
Let’s talk about what this means for where you live right now.
The Southwest’s water-heat double threat

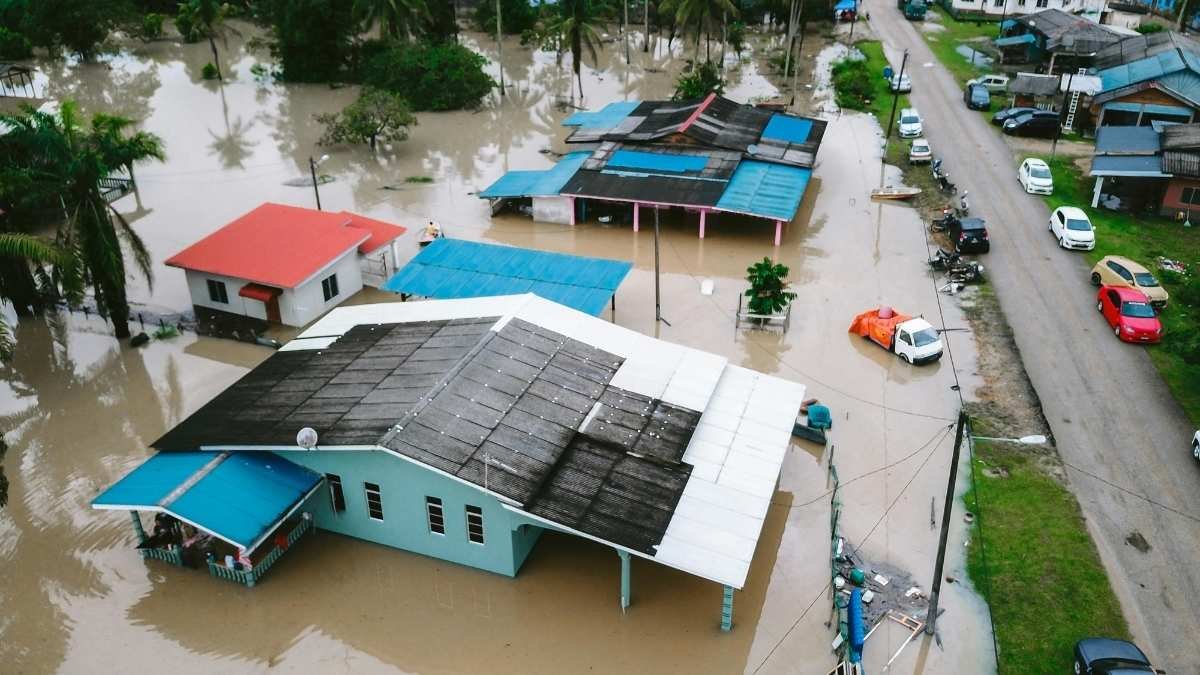
If you’re in Arizona, Nevada, or New Mexico, you’re facing a brutal one-two punch. The Colorado River—your lifeline—experienced its first-ever shortage declaration in August 2021 after 22 years of historic drought. Meanwhile, your region is approaching heat limits where even minimal outdoor activity becomes dangerous.
The numbers don’t lie: Since 2001, heat-related crop insurance claims in the Southwest alone have exceeded $1.3 billion. That’s just the beginning.
The Gulf Coast’s $18 billion problem
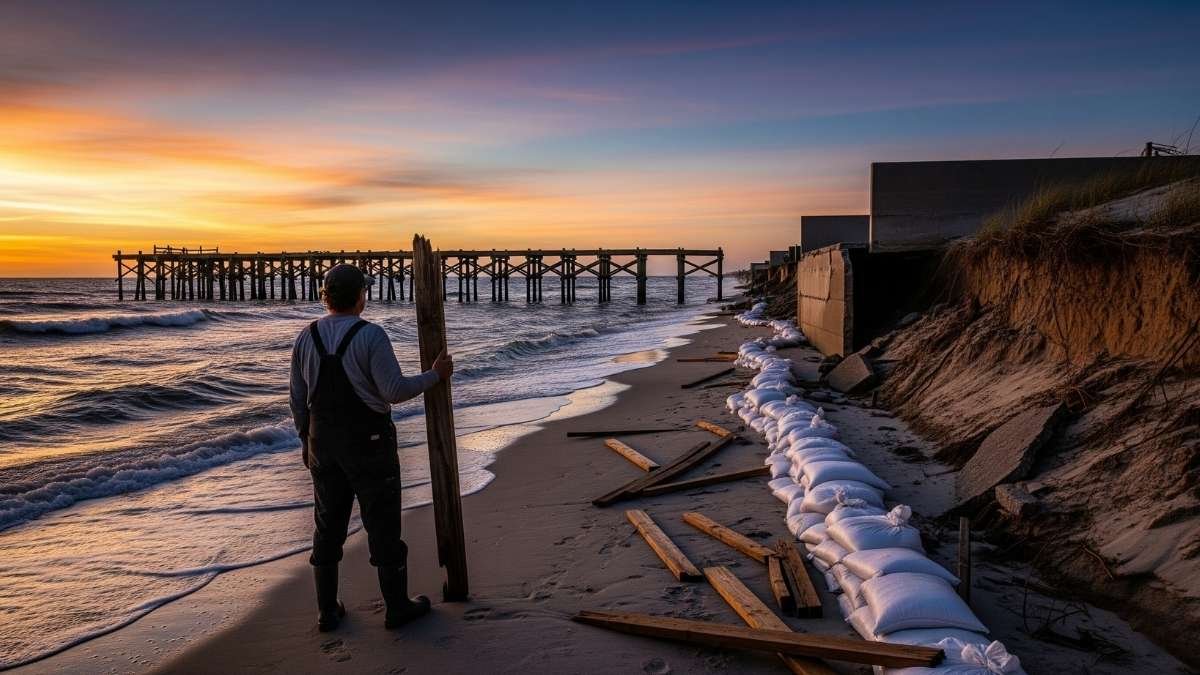
Living along the Gulf Coast? You’re currently experiencing $14 billion in annual losses from hurricane winds, land subsidence, and rising seas. By 2030—just five years away—those losses could balloon to $23 billion annually.
Here’s the kicker: the Gulf Coast population is exploding, expected to reach 74 million people by 2030 (up from 48.6 million in 2000). More people, bigger storms, higher costs, and less livable conditions.
The Southeast’s compound catastrophe
From Florida to the Carolinas, you’re not just dealing with more dangerous heat days. You’re facing what scientists call “compound extreme events”—multiple disasters happening simultaneously that overwhelm aging infrastructure designed for yesterday’s climate.
Your cities, roads, and emergency systems simply weren’t built for what’s coming.
Why 2030 changes everything

Here’s why this decade—these next five years—represents a critical tipping point for American habitability.
By 2030, the dominoes start falling fast:
• 500 million people worldwide will face extreme heat exposure (up from just 100 million in 2000) • 15 million Americans and $177 billion in urban property will face annual coastal flooding damage • 132 million people and $535 billion in property will confront annual river flooding • The number of “dangerous” heat events in America will jump from 4 per year to about 10 per year
Think about that last statistic for a moment. We’re going from dealing with dangerous heat events every few months to dealing with them every month.
Your air conditioning bills? Your emergency services? Your local hospital’s capacity during heat waves? None of it is prepared for this reality.
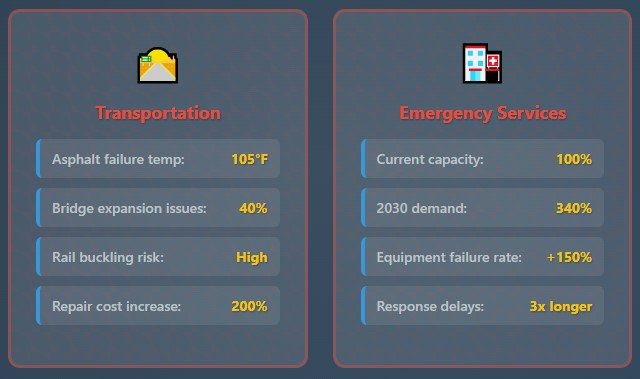
The infrastructure collapse you haven’t heard about
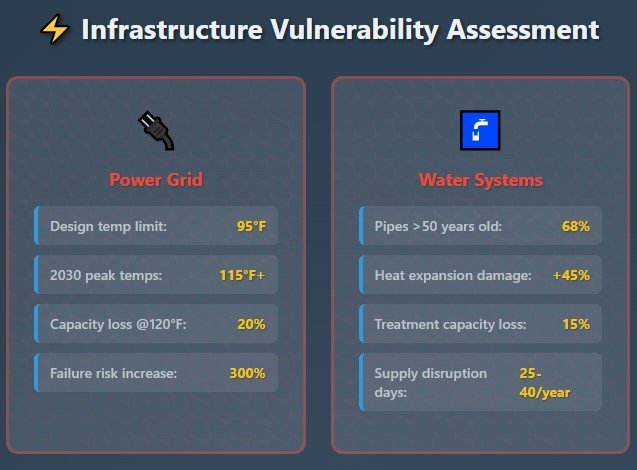
While everyone focuses on dramatic hurricanes and wildfires, a quiet infrastructure catastrophe is unfolding that will reshape where Americans can actually live.
Consider these staggering vulnerabilities:
More than $1 trillion worth of property sits within 700 feet of the coast. By 2050, up to $106 billion worth of coastal property will likely be underwater. That’s not a distant future problem—it’s a “start planning your move now” problem.
Your power grid? It’s already straining during extreme heat events. As temperatures soar beyond design limits, expect rolling blackouts to become routine during the hottest days when you need cooling most.
Even America’s food system is buckling. Corn crops alone lose $720 million annually from heat-induced yield declines. As more growing regions hit habitability limits, expect food prices to reflect the true cost of climate change.
The $500 billion annual price tag

Let’s talk money, because climate change is about to get very expensive for every American household.
The current damage report:
- Flooding costs Americans $179.8 billion to $496 billion annually
- Climate change overall inflicts $16 million per hour in global damages
- Just in 2023, 25 weather disasters cost Americans more than $73 billion
But here’s what makes this personal: these aren’t abstract economic statistics. They’re your insurance premiums, your property values, your tax dollars funding disaster relief, and your grocery bills reflecting agricultural losses.
The great American climate migration begins
🚛 Climate Migration Patterns by 2030
📅 Migration Timeline
Perhaps the most profound change coming is one we’re barely talking about: climate migration is about to reshape America.
Scientists project that 0.4 to 10 million Americans will migrate due to sea-level rise alone between now and 2100. But here’s the multiplier effect that will touch every community: each 1.5 million climate migrants creates a total demographic impact of 15 million people due to cascading effects.
Translation? Even if your town isn’t directly hit by climate change, you’ll likely be affected by people fleeing places that are.
This isn’t just about coastal Florida or desert Arizona. Climate migration will strain infrastructure, housing markets, and social services in receiving communities across the country. Your “safe” inland city might suddenly face rapid population growth from climate refugees.
What survival actually looks like
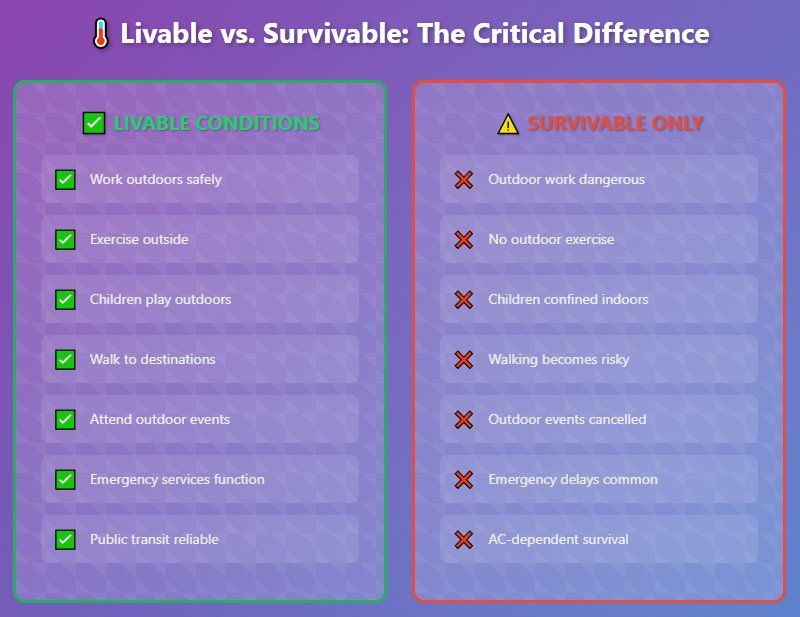
Here’s the reality check nobody wants to give you: millions of Americans are already living in areas that will soon become “survivable but not livable.”
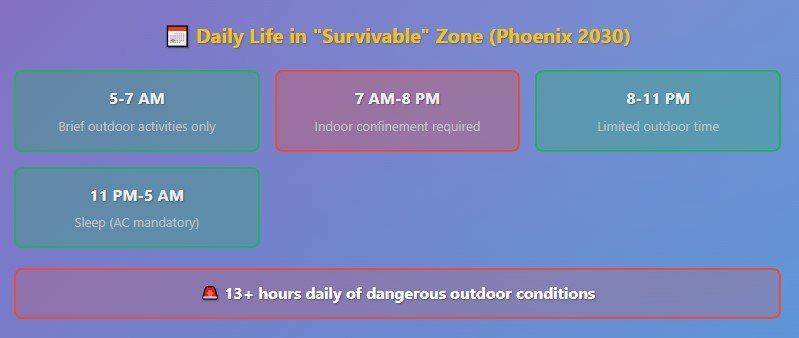
Take Al Hudaydah, Yemen—a port city of 700,000 people that could face 300+ days annually exceeding human tolerance limits under 4°C of warming. That’s not a developing world problem. Similar conditions are projected for parts of Arkansas, Missouri, and Iowa within 50 years.
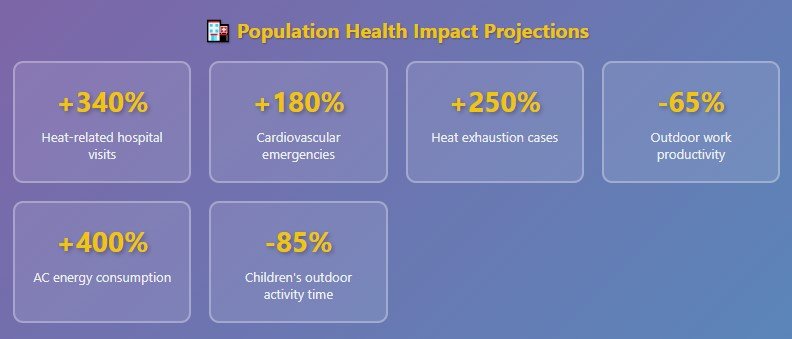
“Survivable but not livable” means you can’t work outside. You can’t exercise outdoors. Older adults can barely walk slowly without risking heat stroke. Children can’t play outside. Your entire life gets squeezed into air-conditioned spaces during increasingly long, hot seasons.
Is that really living?
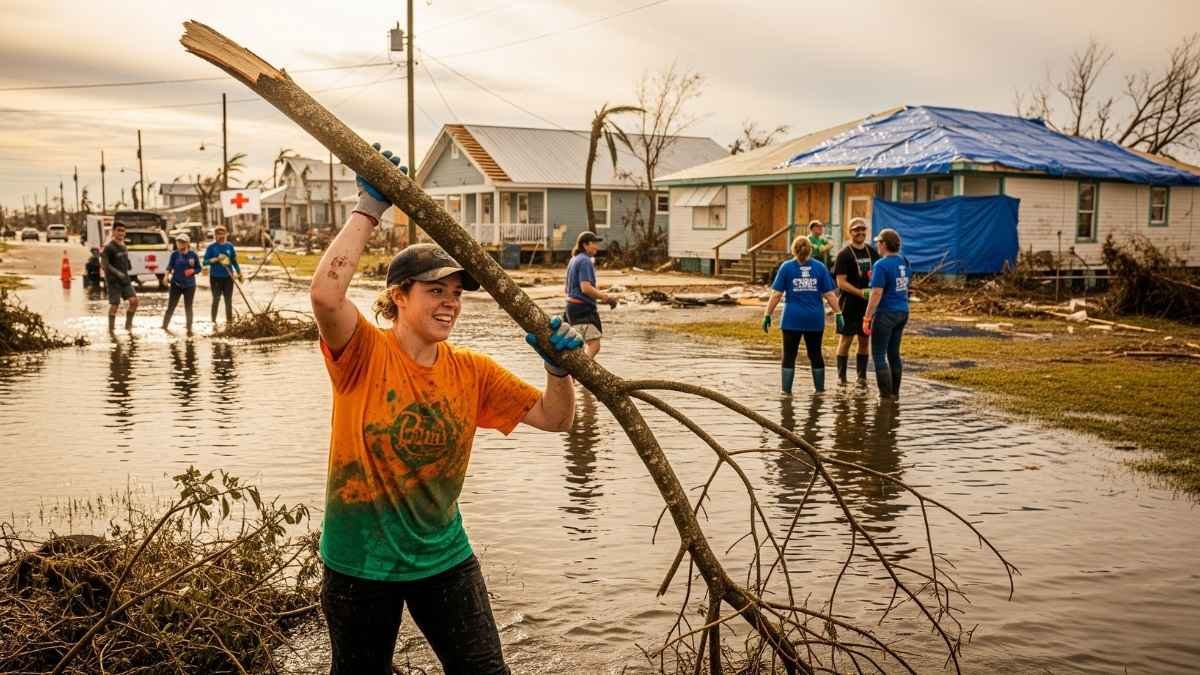
The science of compound disasters
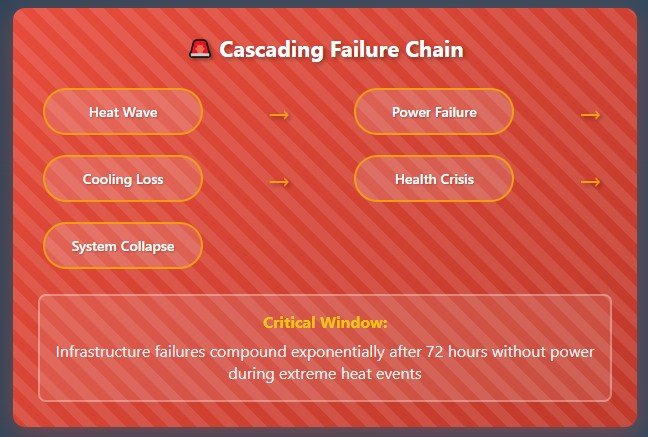
What makes this crisis uniquely dangerous is something scientists call “compound events”—multiple climate disasters hitting simultaneously.
A hurricane cuts power to your Gulf Coast city during a heat wave. No air conditioning for days during temperatures that exceed human tolerance. Emergency services overwhelmed by flooding can’t respond to heat-related emergencies. Hospitals lose backup power.
This isn’t science fiction. Hurricanes Maria and Irma disrupted critical services for extended periods in U.S. territories. The 2021 Pacific Northwest heatwave—made 2-4°F hotter by climate change—caused unprecedented strain on emergency systems not designed for those temperatures.
Your local infrastructure isn’t prepared for the convergence of multiple climate disasters.
The inequality multiplier
Climate change doesn’t affect everyone equally, and the habitability crisis will hit some communities much harder than others.
Low-income communities often lack reliable air conditioning, live in heat-trapping urban areas, and work outdoor jobs that become increasingly dangerous. They’re also least able to migrate when conditions become unlivable.
Meanwhile, older adults—our fastest-growing demographic—face the lowest heat tolerance thresholds. In many regions, adults over 65 cannot safely perform activities beyond slow walking during heat events.
This isn’t just an environmental issue. It’s a justice issue.
Your action plan for the habitability crisis
🎯 Your Climate Habitability Action Plan
- Research local climate projections for your area
- Review insurance coverage & flood maps
- Install backup cooling systems
- Build emergency supply kit
- Download climate & emergency apps
- Assess home vulnerability & upgrades
- Install solar + battery backup
- Plan transportation alternatives
- Join local climate adaptation groups
- Engage with local climate planning
- Evaluate relocation options
- Develop remote work capabilities
- Adjust investment & retirement planning
- Learn climate adaptation skills
- Build resilient community networks
🛠️ Essential Resources & Tools
So what do you actually do with this information? Here’s your practical roadmap:
Assess your vulnerability immediately: Research your local climate projections through 2030. Check flood maps, heat projections, and infrastructure vulnerability assessments for your specific location.
Plan for infrastructure failures: Invest in backup cooling options, emergency supplies for compound disasters, and communication plans for when normal services fail.
Consider your timeline: If you’re planning to live in a vulnerable area for the next 10-20 years, start factoring habitability limits into major life decisions—home purchases, retirement planning, and where to raise children.
Engage locally: Push for climate adaptation in your community. Support infrastructure upgrades, emergency preparedness improvements, and policies that protect vulnerable populations.
Vote like your habitability depends on it: Because it does. Support leaders who take the 2030 timeline seriously and prioritize rapid emissions reductions alongside adaptation planning.
The window for action is closing
We’re not just facing gradual climate change anymore. We’re approaching rapid habitability thresholds that will fundamentally reshape where Americans can live, work, and thrive.
The difference between 1.5°C and 2°C of warming isn’t academic—it’s the difference between challenging conditions and uninhabitable regions. Between expensive adaptation and forced migration. Between managed transition and chaotic displacement.
The next five years matter more than any five years in human history.
Every month of delay in both emissions reductions and adaptation planning makes the coming habitability crisis worse. Every local election, every infrastructure decision, every personal choice either prepares us for this reality or leaves us more vulnerable to it.
The question isn’t whether climate change will affect habitability in your region. The question is whether you’ll be ready when it does.
Ready to understand your specific climate risk? Start by researching your local climate projections at the NCA Atlas (atlas.globalchange.gov) and engaging with your community’s adaptation planning process. The conversations we have today determine whether we manage this transition or get overwhelmed by it.