
Ever wonder why economists can spot a recession coming from miles away, yet we’re always surprised when it actually hits?
Here’s something that’ll blow your mind: Every major recession in the past 170 years has followed the same four-phase pattern. Doesn’t matter if it was triggered by a housing bubble, a pandemic, or even a tulip craze back in the day.
It’s like watching the same movie over and over again, just with different costumes and actors. The plot? Always identical.
The Recession Recipe That Never Changes
📊 The 4-Phase Recession Cycle (Historical Averages)
Optimism peaks
Risk tolerance high
Confidence cracks
Smart money exits
Mass layoffs
Asset prices fall
Confidence rebuilds
Cycle restarts
You’re watching a thriller where the hero walks into a dark room, and you’re screaming “Don’t go in there!” at the screen. That’s basically what economists do during every economic expansion.
Here’s the playbook every recession follows:
Phase 1: The Good Times 📈
- Everyone’s making money
- Credit flows like water
- “This time is different” becomes the national motto
Phase 2: The Cracks 🔍
- Smart money starts getting nervous
- Warning signals flash (but most people ignore them)
- Debt levels reach unsustainable heights
Phase 3: The Crash 💥
- Something breaks (could be anything)
- Panic spreads faster than wildfire
- Everyone runs for the exits at once
Phase 4: The Cleanup 🧹
- Governments step in with big solutions
- Markets slowly rebuild confidence
- We promise “never again” (spoiler: it happens again)
The Math That Predicts the Future

Want to know something crazy? There’s one simple indicator that’s called every single U.S. recession since 1960, with only one false alarm.
It’s called the yield curve, and here’s how it works:
Normally, long-term government bonds pay higher interest rates than short-term ones. Makes sense, right? You want more reward for tying up your money longer.
But when this flips—when short-term rates are higher than long-term ones—it’s like the economy’s check engine light just came on.
The numbers are scary accurate:
- Normal curve = Less than 5% chance of recession
- Flat curve = About 25% chance
- Inverted curve = Up to 90% chance
Think of it as your economy’s fever thermometer. And right now? It’s been running hot.
Why Your Brain is Wired for Recessions

Here’s where it gets really interesting. Turns out, recessions aren’t just about numbers and policies. They’re about human psychology.
Nobel Prize winners George Akerlof and Robert Shiller discovered something fascinating: our brains are hardwired to create economic cycles.
The Confidence Rollercoaster

Remember 2006? Everyone and their grandmother was flipping houses. People who’d never read a financial statement were convinced they were real estate geniuses.
That’s not stupidity—that’s biology.
When things are going well, our brains flood with optimism chemicals. We take bigger risks. We ignore warning signs. We literally become overconfident because our neural wiring evolved for simpler times.
Then, when reality hits, the same brain chemistry that made us reckless makes us terrified. We stop spending. We hoard cash. We assume the worst about everything.
It’s like a psychological pendulum that never stops swinging.
The Debt Trap That Gets Us Every Time
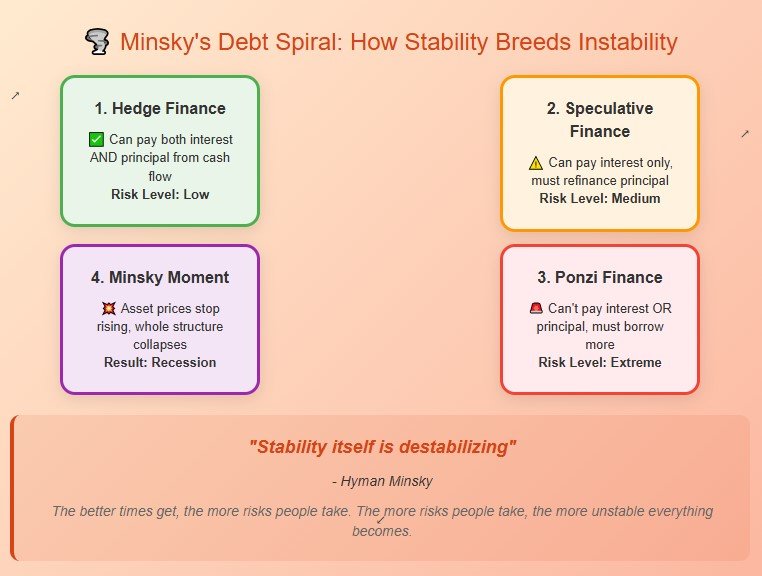
Here’s the pattern that economist Hyman Minsky figured out decades ago. He called it the “Financial Instability Hypothesis,” but I like to think of it as the Debt Death Spiral.
Stage 1: Times are good, so you borrow money to make more money. Smart!
Stage 2: Times are still good, so you borrow even more money. Hey, why not?
Stage 3: Now you’re borrowing money just to pay the interest on your previous borrowing. Uh oh.
Stage 4: Everything collapses because the whole thing was built on borrowed time and borrowed money.
Minsky had a brilliant insight: “Stability itself is destabilizing.”
The better things get, the more risks people take. The more risks people take, the more unstable everything becomes. It’s like economic physics.
When Different Triggers Create Identical Outcomes
📊 Three Different Triggers, One Identical Pattern
Let’s look at three completely different recessions:
1929: Stock Market Speculation Gone Wild
- Duration: 43 months
- Unemployment hit 25%
- GDP fell 30%
2008: Housing Bubble Bursts
- Duration: 18 months
- Unemployment hit 10%
- GDP fell 4.3%
2020: Global Pandemic
- Duration: 2 months (shortest ever)
- Unemployment spiked to 14.7%
- GDP fell 31% (annualized)
Three completely different causes. One was speculation, one was housing, one was a virus.
But guess what? The four-phase pattern played out identically every time.
It’s like different keys playing the same song.
The Recession Crystal Ball (And Why It’s Getting Cloudier)
So where are we now?
As of August 2025, the economic fortune tellers are split:
- J.P. Morgan says: 20% recession chance (down from 40% earlier)
- Goldman Sachs: Was screaming 45%, now much quieter
- The Fed’s models: About 29% probability
But here’s what’s really interesting: For the past two years, Wall Street’s best economists have been too pessimistic about the U.S. economy.
Why? The economy might be evolving faster than our recession playbook.
The Digital Economy Curveball

Remember when tech stocks were the first to crash in recessions? That playbook might be getting rewritten.
In Germany, while the broader economy is struggling, their digital sector is growing at 4.6% annually. Tech companies have become more like utilities—essential infrastructure rather than luxury purchases.
Translation: The next recession might look different than the last one, even if it follows the same psychological pattern.
What This Means for Your Wallet
Okay, enough theory. What can you actually do with this information?
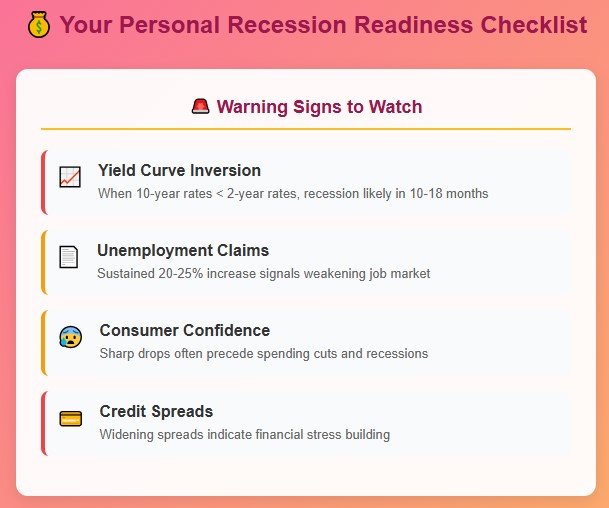
Watch These Warning Signs
The Yield Curve: When long-term bonds pay less than short-term ones, start paying attention. Historically, recessions follow within 10-18 months.
Unemployment Claims If weekly jobless claims consistently rise 20-25%, that’s your labor market sending smoke signals.
Consumer Confidence: When people stop feeling good about the future, they stop spending. And when people stop spending, recessions follow.
Know Your Economic Position
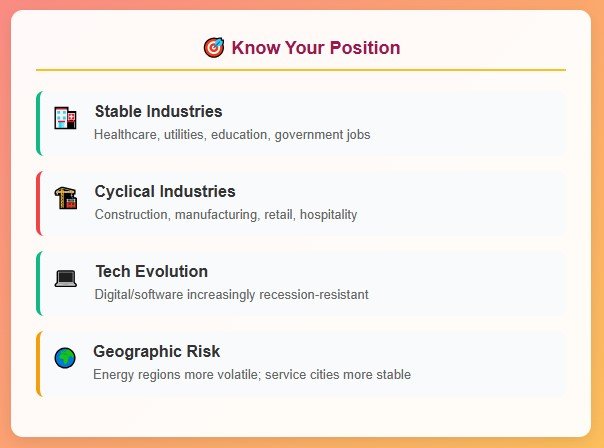
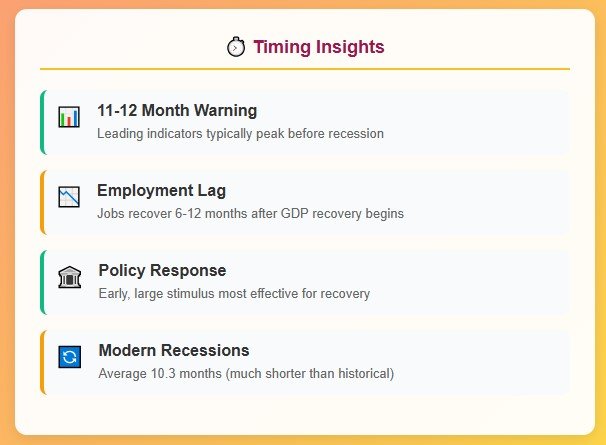
Industry Reality Check:
- Most vulnerable: Construction, manufacturing, retail, and restaurants
- Most stable: Healthcare, utilities, education, government jobs
Geographic Factor:
- Energy-heavy regions (Texas, North Dakota): More volatile
- Service-heavy cities (D.C., Boston): More stable
- Tech hubs: Increasingly recession-resistant
The Investment Timing Game

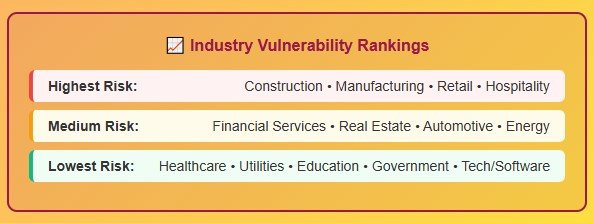
Here’s the thing about recession timing: You don’t need to predict exactly when. You just need to understand the pattern.
Early warning signals typically give you 11-12 months of heads up. That’s enough time to:
- Build up your emergency fund
- Diversify your income sources
- Avoid taking on new debt
- Look for opportunities (recessions create them too)
The Deeper Truth About Economic Cycles

Want to know the real reason recessions keep following the same pattern?
It’s not about complex financial instruments or government policies (though those matter). It’s about three fundamental forces that never change:
1. Math Doesn’t Lie Compound interest, debt ratios, and leverage follow mathematical laws. When debt grows faster than income for long enough, something has to give.
2. Humans Gonna Human We’re wired to follow the crowd, especially during uncertainty. These psychological patterns are older than money itself.
3. Institutional Memory Central banks, governments, and markets respond to crises using similar playbooks. We literally train ourselves to repeat patterns.
The Bottom Line
Here’s what 170 years of data tells us: Recessions aren’t bugs in the economic system—they’re features.
They’re predictable consequences of how human psychology interacts with money, debt, and group behavior.
Understanding this won’t help you time the market perfectly. But it will help you see the warning signs, prepare for the inevitable, and maybe—just maybe—avoid screaming at the economic horror movie when the hero walks into that dark room.
The next recession is coming. Not because I’m pessimistic, but because they always do.
The question isn’t if—it’s when, and whether you’ll be ready.
What recession warning signs are you seeing in your industry or region? Share your observations in the comments below—sometimes the best economic intelligence comes from people actually living and working in the economy, not just studying it.


